



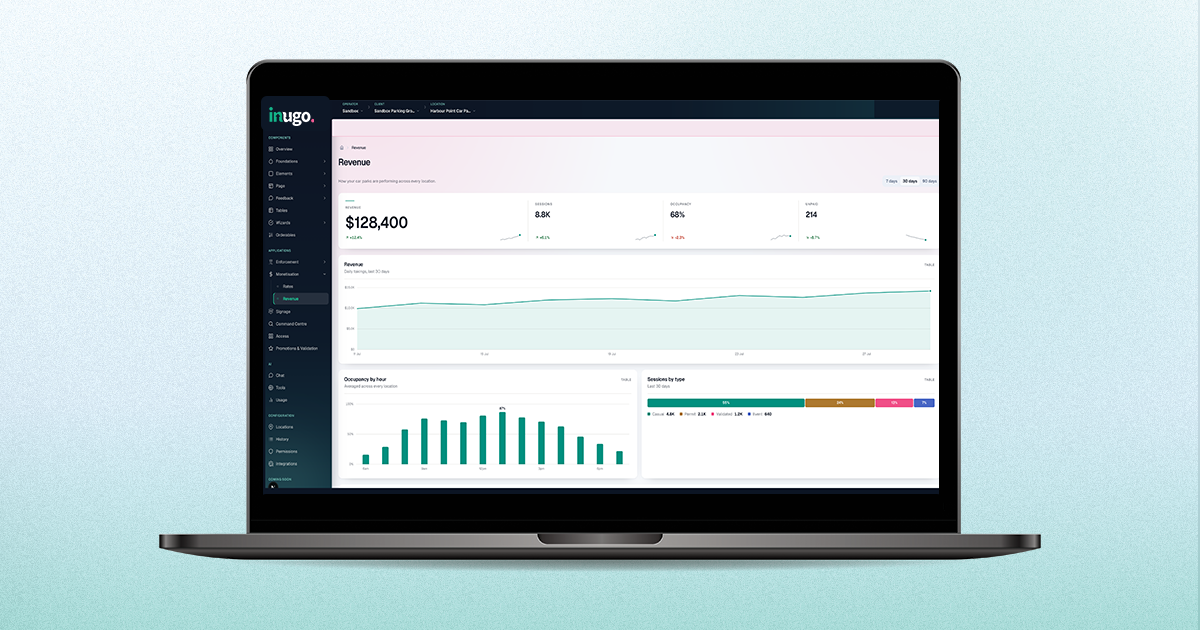
Most parking operators have more data than they've ever had. And most of them still can't answer a simple question - what happened across my sites last week? - without opening multiple reports, waiting for someone to compile a spreadsheet, or making a phone call to find out.
That gap between having data and being able to use it is the real problem. Not a lack of information. A lack of a single place to see it.
Inugo Analytics is the reporting and visibility layer built into the Inugo platform. It's not a separate tool or an add-on - it's there from the moment a site goes live, pulling from the same system managing access, payments, occupancy, and enforcement.
Here's what that looks like in practice.
SEE EVERY SITE IN ONE PLACE
If you're running more than one site, revenue, activity, and occupancy are consolidated in a single interface. You're not logging into separate dashboards or waiting for someone to pull figures from each location.
This matters most when something needs attention. If one site's transaction volume looks low on a Monday morning, you see it in the same view as everything else - not because someone mentioned it.
FINE REVENUE YOUR MISSING
Most operators have a sense of which sites perform well. Fewer can point to exactly why one location underperforms, or where the pricing opportunity is, without digging through data manually.
Inugo Analytics makes that visible. Occupancy patterns show when a site is consistently at capacity and potentially underpriced. Transaction data shows where volume is lower than it should be for the footfall. Comparing sites against each other, across the same time periods, reveals things that stay hidden when you're looking at each location in isolation.
The goal isn't more data. It's making the data you already have actionable - so a pricing decision or an access change is based on what's actually happening, not a gut feel.
WHAT OPERATORS ARE ACTUALLY ASKING FOR
When operators tell us they want better reporting, they're usually describing one of three things.
Speed. They want to know what's happening now, not at the end of the month. Revenue, transaction counts, and occupancy update in real time. If a rate change goes live and you want to know whether it's affecting transaction volume within the first few days, you can check.
Breadth. They want to see the whole portfolio at once - not a site-by-site comparison assembled in Excel, but a live view of how every location is performing against the same metrics. Filter by site, by time period, by rate type, or by customer group.
Depth on demand. When something looks off, or a dispute lands in the inbox, they want to go from summary view to individual record without switching systems or waiting for access. When you need a formal report - for a board presentation, an audit, a client review - you generate it from the platform. No request process, no reformatting a CSV. The report reflects what's in the platform, which is the same data used to open gates and process payments.
HOW IT CONNECTS TO THE REST OF THE PLATFORM
Because Inugo Analytics sits inside the same platform as access, enforcement, and occupancy, the data is connected in ways that are harder to achieve when reporting is a separate system.
An LPR event at the gate, a payment through the kiosk, an occupancy count, a citation issued - they all feed the same record. So when you're looking at a site's performance, you're seeing the full picture, not a partial one assembled from different sources.
A TYPICAL MORNING
An operator opens their dashboard in the morning. Every site is visible in one view - revenue running, occupancy live, access events logged. One location is showing lower-than-usual transactions for a Tuesday. They drill in, check the gate activity, and identify that one access group hasn't been configured correctly since a rate change last week. Fixed before it becomes a complaint.
Later that day, a customer emails disputing a charge. The operator pulls up the plate, sees the full session history across three sites over six months, and responds with the accurate record in two minutes.
Neither of those things required a separate report. Neither required a call to support. The data was already there, in one place, in a format that made it usable.